AIR QUALITY MONITORING

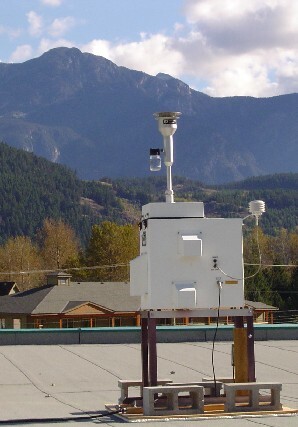
The Village is working in partnership with Vancouver Coastal Health to improve the monitoring of air quality in the Village. This effort helps residents by improving awareness of real-time air quality throughout the year.
The Village of Pemberton enjoys exceptionally good air quality most of the year by most standards. However, smoke from wildfires across the region can have a serious impact on air quality and thus the health of residents. Lesser sources of poor air quality in the Village are exhaust gases from vehicles and smoke from wood stoves used for residential heating in the winter.
For background information on Air Quality Planning in the Sea to Sky Corridor visit the BC Air Quality website or Sea-to-Sky Clean Air Society website.
In order to monitor air quality in the Sea-to-Sky air shed several permanent monitoring stations have been established in communities along the Sea-to-Sky corridor. By installing air pollution monitors near village centers we can sample air that is similar to the air experienced by many of the community's residents. Datasets from monitoring stations are used to evaluate air quality events and to determine trends over time. From this information, we will be able to ensure that human and ecosystem health is protected and that villages such as Pemberton continue experiencing exceptional air quality. Additionally, information from monitoring stations can be used to make decisions regarding public air quality warnings.
PARTICULATE MATTER (PM)
One of the main air pollutants in the Sea-to-Sky corridor is particulate matter (PM). Particulate matter is broken into two main components, PM10 and PM2.5. PM10 refers to atmospheric particles that are less than 10 mm in diameter and PM2.5 represents particles that are less than 2.5 mm in diameter. Particulate matter is of concern because of the potential health effects associated with inhaling particles.
HEALTH CONCERNS
Fine particles are of particular concern because they can be inhaled and deposited deep within the lungs. Fine particulates can chronically and/or acutely aggravate cardiovascular or pulmonary diseases and may increase symptoms in people suffering from asthma. Recent studies indicate that there is no safe level for particulate matter meaning that health effects can occur in vulnerable individuals even at low particulate concentrations.
SOURCES OF PM
Fine particulates (PM10 and PM2.5) are directly emitted by many sources including industrial, mobile, and area sources. Primary sources of PM10 in the Sea-to-Sky airshed are from the pulp and paper industry as well as mobile sources (including road dust), and area sources (burning, space heating). The sources of PM2.5 are similar to PM10 except that PM2.5 can also be formed as a secondary particulate through reactions with other air pollutants (such as ammonium nitrate and ammonium sulfate) in the atmosphere. Particulate matter can also arise from natural sources. In the Sea-to-Sky airshed, the biggest natural source of PM10 and PM2.5 is wildfires.
NEW MONITORS
Particulate matter (PM2.5) has been measured in Pemberton since September 2005. The Village of Pemberton has since upgraded and located new sensors to provide real time monitoring of the air residents are experiencing. Six new continuous PM2.5 monitors were added, one outside and one inside the municipal hall in July 2022. Then in January 2023 one was added outside at the community center, up the meadows, industrial park, and wastewater treatment plant. The Pemberton monitoring locations is an ideal site as it is near the town's center and also in an area that will experience growth in the future. All live data is visible and available for download from PurpleAir at Real-Time Air Quality Map | PurpleAir
INTERPRETING RESULTS
An air quality index is a number used by government agencies to communicate to the public how polluted the air currently is or how polluted it is forecast to become. This information along with some suggestions on how you might adjust your activity levels depending on your individual health risk from air pollution. The air quality is calculated based on the relative risks of a combination of common air pollutants such as particle matter, ozone, and nitrogen dioxide.
TABLE 1: PURPLEAIR QUALITY INDEX
| 0-50 | 51-100 | 101-150 | 150-200 | 201-300 | >300 |
|
Air quality is satisfactory, and air pollution poses little or no risk with 24 hours of exposure. |
Air quality is acceptable. However, there may be a risk for some people with 24 hours of exposure, particularly those who are unusually sensitive to air pollution. | Members of sensitive groups may experience health effects with 24 hours of exposure. The general public is less likely to be affected. | Some members of the general public may experience health effects with 24 hours of exposure; members of sensitive groups may experience more serious health effects. | Health alert: The risk of health effects is increased for everyone with 24 hours of exposure | Health warning of emergency conditions: everyone is more likely to be affected with 24 hours of exposure. |
OTHER PM MONITORING STATIONS IN THE CORRIDOR
In addition to comparing results to National or Provincial Objective levels, there is interest in comparing data from other areas in the Sea-to-Sky to determine which communities have the best or worst air quality. This data can be seen around the corridor when zoomed out of the PurpleAir Real-Time Map.
RESOURCES
- BC Air Quality website
- Environment Canada Air Quality Index
- Sea-to-Sky Clean Air Society
- Real-Time Air Quality Map | PurpleAir